Semantic Category Disambiguation (SCD)
- Task definition:
- Given: a textual span in it’s context and a set of semantic categories
- Assign: a single semantic category to the span
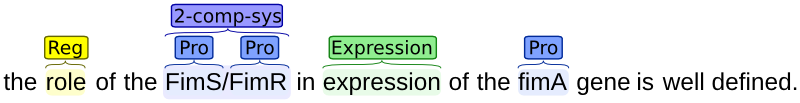
Example: An annotated noun-phrase
- Related to Named Entity Recognition (NER):
- Conceptually NER consists of two sub-problems
- Find textual spans containing entities
- Disambiguate between multiple semantic categories for each span
- Conceptually NER consists of two sub-problems